This article is part of our The Z Files series.
It's been well documented that power is down because the ball is not traveling as far. Here is the data through April of each season since 2021.
| Season | HR/PA | HR/FB | Flyball Average Exit Velocity | Average FB Distance |
|---|---|---|---|---|
| 2021 | 3.10% | 10.60% | 92.6 | 319.2 |
| 2022 | 2.40% | 8.80% | 92.1 | 312.9 |
| 2023 | 3.00% | 10.20% | 92 | 315.3 |
| 2024 | 2.70% | 9.30% | 92 | 313.2 |
Many are focusing on why the flyball average exit velocities over the past three seasons are nearly identical, yet the ball is traveling different distances. This has to do with the composition of the ball, with seam height, weight of the ball and coefficient of restitution all contributing factors.
While this is an intriguing scientific study, those playing fantasy baseball don't care why the ball's flight is hindered; we want to know the repercussions. Will the influence be the same for every hitter and every pitcher?
In 2021, the average flyball distance was 3.9 feet longer than 2023, resulting in a 0.4 percent increase in home runs per flyball (HR/FB). The average flyball distance was 2.4 feet more in 2023 as compared to 2022. However, even knowing this is 1.5 feet fewer than 2021 to 2023, the HR/FB increased by 1.4 percent.
The above suggests the HR/FB is not proportional to the average flyball distance. Identifying the inflection will help pinpoint the subset of hitters and pitchers most affected by the reduced ball flight.
The following was done to understand the relationship between HR/FB and average flyball distance. The number of homers per
It's been well documented that power is down because the ball is not traveling as far. Here is the data through April of each season since 2021.
| Season | HR/PA | HR/FB | Flyball Average Exit Velocity | Average FB Distance |
|---|---|---|---|---|
| 2021 | 3.10% | 10.60% | 92.6 | 319.2 |
| 2022 | 2.40% | 8.80% | 92.1 | 312.9 |
| 2023 | 3.00% | 10.20% | 92 | 315.3 |
| 2024 | 2.70% | 9.30% | 92 | 313.2 |
Many are focusing on why the flyball average exit velocities over the past three seasons are nearly identical, yet the ball is traveling different distances. This has to do with the composition of the ball, with seam height, weight of the ball and coefficient of restitution all contributing factors.
While this is an intriguing scientific study, those playing fantasy baseball don't care why the ball's flight is hindered; we want to know the repercussions. Will the influence be the same for every hitter and every pitcher?
In 2021, the average flyball distance was 3.9 feet longer than 2023, resulting in a 0.4 percent increase in home runs per flyball (HR/FB). The average flyball distance was 2.4 feet more in 2023 as compared to 2022. However, even knowing this is 1.5 feet fewer than 2021 to 2023, the HR/FB increased by 1.4 percent.
The above suggests the HR/FB is not proportional to the average flyball distance. Identifying the inflection will help pinpoint the subset of hitters and pitchers most affected by the reduced ball flight.
The following was done to understand the relationship between HR/FB and average flyball distance. The number of homers per 200 flyballs was graphed against average flyball distance from last season. A batter needed to loft 50 flyballs in 2023 to be included. A rolling average was utilized to smooth variance. Here is the result:
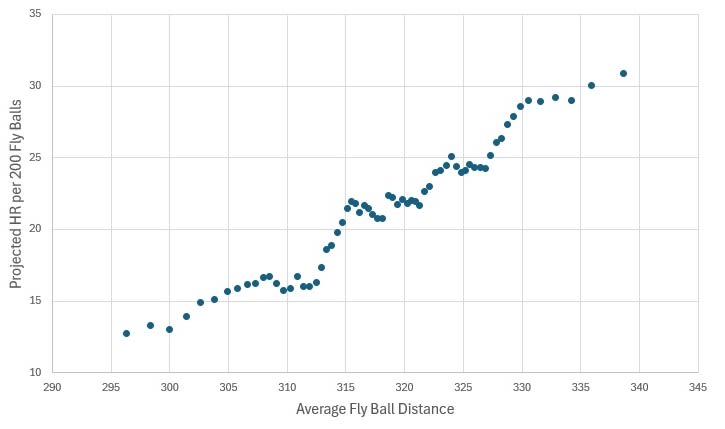
Look at the steepness of the slope between around 311 and 316 feet. Batters will lose disproportionately more homers when their average flyball distance falls within this range. Percentagewise, a batter will lose more homers if their average flyball distance drops from 315 last season to 313 as it would if the distance dipped from 323 to 321. Pitchers with an average flyball distance around 315 last season will yield disproportionately fewer homers this season since the loss of two feet falls on the steep portion of the curve.
For what it's worth, triggered by 2019's happy fun ball, I have conducted this study every offseason since, with nearly identical results each time.
If this decreased ball flight was known heading into drafts, all batters would be subject to a projected homer decrease, but those with a 2023 average flyball distance between 313 and 316 feet would be most vulnerable since their two-foot loss lands in the steep part of the curve.
Unfortunately, things aren't that easy. Confining the pool to batters with the same team from 2021-2023, the normalized average flyball standard deviation was a bit below seven feet. Normalizing the averages accounts for the different league levels, while only using players with the same team removes the venue bias. The results indicate a player's average flyball distance can be plus or minus seven feet the following season just due to variance. This increases the target group to those with a 2023 average flyball distance between 313 and 323 feet.
Using an average flyball distance of 319, let's say the player drops four feet from variance and two feet from the reduced flight this season. Admittedly, these are selected to match the data in the first table, but it's a plausible scenario and we know the HR/FB for each.
Projected Home Runs
| Flyballs | 319 Feet | 313 Feet | Difference |
|---|---|---|---|
| 50 | 5.3 | 4.4 | 0.9 |
| 100 | 10.6 | 8.8 | 1.8 |
| 150 | 15.9 | 13.2 | 2.7 |
| 200 | 21.2 | 17.6 | 3.6 |
The cutoff where the projected drop is relevant is arbitrary, since total homers itself is subject to variance with a sudden wisp of wind keeping the ball in the yard or sending it over the fence. Deeming fewer than 2.5 homers lost as insignificant is more empirical than scientific, but that's what I'm going to do. Using the above table, this equates to around 15 projected homers.
Ninety-nine players lofted at least 50 flyballs with an average distance ranging from 313 to 323 feet last season. Adding the filter of at least 15 projected homers reduces the tracking group to a more practical 65 batters:
By means of reminder, had I known the average flyball distance would be two feet shorter this season, I would have suggested the above 65 hitters would lose proportionately more homers than the rest of the field. There is so much more involved with respect to a flyball clearing the fence, so the advice would have been to use the information to break a tie, and not substantially alter rankings.
Applying the methodology to pitchers with 100 projected innings and a flyball rate of at least 35 percent last season, here are the pitchers standing to benefit the most from the 2024 environment:
| Pitcher | Average Flyball Distance |
|---|---|
| Chris Sale | 323.3 |
| Jesus Luzardo | 323 |
| Kodai Senga | 322.6 |
| Kevin Gausman | 322.4 |
| Adrian Houser | 322.3 |
| James Paxton | 321.6 |
| Josiah Gray | 321.4 |
| Logan Allen | 321.3 |
| Cal Quantrill | 320.6 |
| Jameson Taillon | 320.5 |
| MacKenzie Gore | 320.1 |
| Zack Littell | 320 |
| Eury Perez | 319.6 |
| Lance Lynn | 319.5 |
| Luis Castillo | 319.5 |
| Kenta Maeda | 318.9 |
| Tyler Wells | 318.6 |
| Justin Verlander | 318.5 |
| Spencer Strider | 318.1 |
| Michael Lorenzen | 317.9 |
| Drew Smyly | 317.8 |
| Jose Berrios | 317.8 |
| Zack Greinke | 317.7 |
| Taijuan Walker | 317.3 |
| Carlos Rodon | 317.1 |
| Aaron Nola | 317.1 |
| Cristian Javier | 316.8 |
| Chris Bassitt | 316.2 |
| Joe Ryan | 316.2 |
| Wade Miley | 316.1 |
| Freddy Peralta | 316 |
| Martin Perez | 315.8 |
| Clarke Schmidt | 315.3 |
| JP Sears | 314.6 |
| Michael King | 314.5 |
| Jose Quintana | 314.1 |
| Hunter Greene | 314.1 |
| Dylan Cease | 313.8 |
| Andrew Abbott | 313.6 |
| Kutter Crawford | 313.4 |
| Dean Kremer | 313.4 |
| Bailey Ober | 313.3 |
| Jon Gray | 313.2 |
| Andrew Heaney | 313.1 |
| Eduardo Rodriguez | 313 |
| Jordan Lyles | 313 |
As opposed to using the batting data to break a tie, moving these pitchers up the rankings a bit would have made sense, since the reward for identifying a better starting pitcher is greater than discovering a batter since their innings contribute more to your team performance, compared to the effect of a hitter's plate appearances.
Of course, the 2024 drafting season is (almost) over. The NFBC offers some "second chance" leagues and I'm sure there are a few others with leagues starting after the first month of the season. Even so, most are likely curious if some of the current performance level is disproportionately emanating from the deduced flight of the ball.
Only six batters fit the criteria using data through April 30, with uncertain results:
| Player | 2024 PA | 2024 Average Flyball Distance | 2024 HR | 2023 PA | 2023 Average Flyball Distance | 2023 HR |
|---|---|---|---|---|---|---|
| Corey Seager | 119 | 313.7 | 2 | 49 | 320.3 | 1 |
| Will Smith | 119 | 313.7 | 3 | 62 | 318.9 | 3 |
| Mark Canha | 118 | 313 | 5 | 100 | 315.1 | 2 |
| Carlos Santana | 106 | 314.8 | 4 | 112 | 322.7 | 2 |
| Kyle Isbel | 88 | 314.2 | 3 | 85 | 317.8 | 0 |
| Hunter Renfroe | 87 | 311.6 | 2 | 120 | 322.2 | 7 |
I mean, is the sole purpose of this entire study to show that Hunter Renfroe's power outage is due to the 2024 baseball? I sure hope not.
What about pitchers? Are there more encouraging results on that front?
| Pitcher | 2024 Average Flyball Distance | 2023 Average Flyball Distance | 2024 HR/9 | 2023 HR/9 |
|---|---|---|---|---|
| Grayson Rodriguez | 314.8 | 323.3 | 1.1 | 1.2 |
| Cole Irvin | 312.3 | 322.3 | 0.6 | 1.3 |
| Michael Lorenzen | 315.4 | 321.5 | 1.1 | 1.2 |
| Jesus Luzardo | 314 | 319.7 | 1.7 | 1.1 |
| Aaron Civale | 312.4 | 317.9 | 1.7 | 0.9 |
| Jose Suarez | 310.8 | 317.7 | 1.7 | 2.7 |
More meh.
Longtime readers know this isn't the first time a seemingly elegant notion generated little actionable consequence. That said, I believe the concept is viable, especially since the sweet spot where homers decline disproportionately is consistent from year to year. It's just that the data is more descriptive than predictive, especially shoehorning one month's worth of numbers into the study. That said, I'll repeat the exercise in a couple months. Though if the conclusions aren't more enlightening, I'll keep them to myself.
One thing I know I'll do is use the season-ending data to help reverse-engineer home runs to better normalize the data before plugging it into my little black box, but that's a story for another day.