


This article is part of our The Z Files series.
Pssst, hey, c'mere, you wanna know a secret? Doing your own projections isn't so bad. In fact, it's rather easy. The trick is relying on someone else for the rate of production, then you massage it with your own playing time. Piece of cake.
The truth is, while those doing projections all have their breakouts to target and land mines to avoid, the projected skills of most players are fairly consistent. What separates different sets is playing time. Hence, to generate your own projections, find a source you trust and adjust to your own PAs and IPs. Maybe even average a couple sources together, then apply your playing time estimation.
What follows are some guidelines when assigning playing time. They're applicable whether you formally do it on a spreadsheet or more casually.
Let's first frame the logical number of plate appearances batter can garner. This is dependent on two things: quality of team and spot in the batting order.
From the desk of Lord Obvious, higher-scoring teams get more plate appearances (PA), lower-scoring squads get fewer. In 2019, the Red Sox led MLB with 6475, followed by the Astros, Twins and Diamondbacks. The Twins, Astros and Red Sox scored the second, third and fourth most runs in the league with the Diamondbacks checking in at 11th. The Yankees led MLB in scoring but finished 15th in PA as they were highly efficient, scoring a huge percentage of their runs via 306 home runs.
The Padres total of 6019 PA was
Pssst, hey, c'mere, you wanna know a secret? Doing your own projections isn't so bad. In fact, it's rather easy. The trick is relying on someone else for the rate of production, then you massage it with your own playing time. Piece of cake.
The truth is, while those doing projections all have their breakouts to target and land mines to avoid, the projected skills of most players are fairly consistent. What separates different sets is playing time. Hence, to generate your own projections, find a source you trust and adjust to your own PAs and IPs. Maybe even average a couple sources together, then apply your playing time estimation.
What follows are some guidelines when assigning playing time. They're applicable whether you formally do it on a spreadsheet or more casually.
Let's first frame the logical number of plate appearances batter can garner. This is dependent on two things: quality of team and spot in the batting order.
From the desk of Lord Obvious, higher-scoring teams get more plate appearances (PA), lower-scoring squads get fewer. In 2019, the Red Sox led MLB with 6475, followed by the Astros, Twins and Diamondbacks. The Twins, Astros and Red Sox scored the second, third and fourth most runs in the league with the Diamondbacks checking in at 11th. The Yankees led MLB in scoring but finished 15th in PA as they were highly efficient, scoring a huge percentage of their runs via 306 home runs.
The Padres total of 6019 PA was the lowest, behind the Tigers, White Sox and Marlins. The Tigers scored the fewest runs, with the Marlins, Giants and Padres just ahead of them. The runs-to-PA correlation isn't perfect, but it gives you a good idea how to frame high-scoring and low-scoring teams.
To that end, here's a table showing the league average number of PA per spot in the batting order last season, along with the breakdown for Boston and San Diego, the two extremes:
| Spot | BOS | AVG | SDP |
|---|---|---|---|
| 1st | 786 | 761 | 734 |
| 2nd | 772 | 743 | 723 |
| 3rd | 756 | 725 | 704 |
| 4th | 744 | 709 | 689 |
| 5th | 727 | 693 | 677 |
| 6th | 703 | 675 | 653 |
| 7th | 681 | 657 | 633 |
| 8th | 661 | 637 | 611 |
| 9th | 645 | 617 | 595 |
On average, there's a difference of 18 PA between adjacent spots in the order. The difference between leadoff and seventh is a whopping 104 trips to the dish. That's akin to a month's worth of playing time. Comparing the two extremes, the same spot in the order was worth 50 additional plate appearances for the highest scoring team.
The problem with many players is their spot isn't locked in, even if it's announced in the spring. Last season, one reason Andrew Benintendi was highly ranked was the report he'd be batting first. He ended the season in the five-hole. Ronald Acuna Jr. hit cleanup before returning to the leadoff spot. Mallex Smith and Cesar Hernandez are examples of players whose playing time, and hence production, dropped since they hit lower in the order than in previous seasons. All any of us can do is guess, so the reminder is be careful when assuming a player will maintain a new spot all season. A lot can happen.
Perhaps the best advice is to be unbiased when assigning playing time. The tendency is to over-project players we like. It's a natural bias. To that end, let's conduct an exercise. It's the New Year, we all resolved to exercise more. For this to be most effective, please just answer the question blindly, with your gut instinct. Don't try to figure out who the players are or read too much into the data. Just answer. Don't worry, the names will be revealed.
Which player will garner more plate appearances in 2020? They're all MLB veterans with more than five seasons in the league. Included is the average of the last three seasons:
Player A: 129 games, 571 PA
Player B: 134 games, 600 PA
Player C: 142 games, 623 PA
Hopefully, you answered Player C, Bryce Harper. As promised, Player A is Mike Trout and Player B is George Springer. Now that you know the names, who are you projecting for the most PA this season?
Here's the result of a couple of Twitter polls I recently ran:
Pop quiz. Who will get more plate appearances in 2020?
— Todd Zola (@ToddZola) December 27, 2019
Follow up to last night's pop quiz...
Who gets more plate appearances in 2020?
— Todd Zola (@ToddZola) December 28, 2019
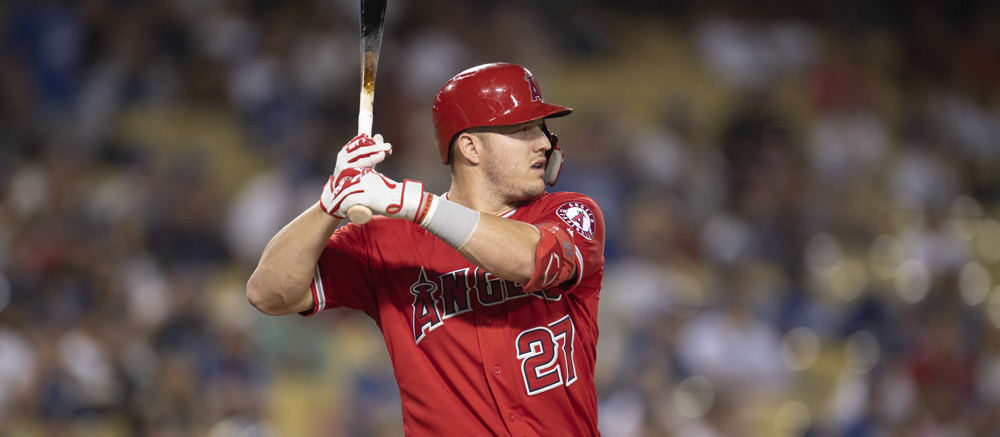
In both cases, Mike Trout was the runaway leader, yet he's played decidedly less than his fellow outfielders since 2017. There are several possible justifications. Some simply could have been unaware of the discrepancies. Maybe some considered Trout's missed time more fluky or less likely to recur.
No one wants to admit it, but there's another reason: FOMO, fear of missing out. FOMO is usually directed towards shiny new toys, like Vladimir Guerrero Jr. this time last season and Luis Robert in early drafts this year. Any other player missing the amount of time Trout has would be penalized. The fact of the matter is, we're all deathly afraid to avoid Trout, "in case this is the season he stays healthy," rationalizing it with pointing out he only missed 16 games combined between 2013 and 2016. While this is true, again, if any other player was out for an average of 33 games the past three seasons, his ADP would suffer.
In the interests of full disclosure, I'm guilty of FOMO as well. Here are my projected PAs for the three principles:
| 2020 | 17-19 | |
|---|---|---|
| Bryce Harper | 666 | 623 |
| Mike Trout | 662 | 571 |
| George Springer | 628 | 600 |
The lesson is, try to be fair when allotting playing time. Artificially raising or lowering it to justify a ranking isn't conducive to assembling a winning roster. It's better to reconsider the ranks.
The final point is in general, be conservative. To illustrate this point, here is a study on plate appearances from the last five seasons. First, this table shows the number of players falling within specified ranges of plate appearances:
| PA | 2019 | 2018 | 2017 | 2016 | 2015 |
|---|---|---|---|---|---|
| 676+ | 21 | 23 | 19 | 33 | 20 |
| 651-675 | 20 | 13 | 16 | 14 | 24 |
| 626-650 | 12 | 15 | 25 | 24 | 14 |
| 601-625 | 16 | 20 | 17 | 17 | 23 |
| 576-600 | 15 | 22 | 13 | 16 | 12 |
| 551-575 | 11 | 14 | 18 | 12 | 17 |
| 526-550 | 23 | 17 | 23 | 18 | 13 |
| 501-525 | 17 | 20 | 13 | 12 | 20 |
| 476-500 | 21 | 15 | 23 | 11 | 15 |
| 451-475 | 13 | 24 | 13 | 17 | 18 |
| 426-450 | 15 | 18 | 19 | 20 | 20 |
| 401-425 | 23 | 13 | 17 | 9 | 15 |
| 376-400 | 11 | 15 | 13 | 12 | 18 |
| 351-375 | 23 | 18 | 18 | 17 | 18 |
| 326-350 | 22 | 16 | 17 | 20 | 7 |
| 301-325 | 10 | 15 | 23 | 15 | 14 |
| 276-300 | 28 | 16 | 12 | 20 | 14 |
| 251-275 | 18 | 17 | 18 | 20 | 29 |
| 226-250 | 27 | 19 | 13 | 20 | 18 |
| 201-225 | 14 | 24 | 17 | 25 | 22 |
The next table presents the percentage of players in each range gaining or losing the specified percentage of plate appearances the following season:
| PA | -10%+ | -10% to -.7.5% | -7.5% to -5% | -5% to -2.5% | -2.5% to 2.5% | 2.5% to 5% | 5% to 7.5% | 7.5% to 10% | 10%+ |
|---|---|---|---|---|---|---|---|---|---|
| 676+ | 35.90% | 7.60% | 7.60% | 10.90% | 29.30% | 6.50% | 2.20% | 0.00% | 0.00% |
| 651-675 | 41.50% | 6.20% | 3.10% | 7.70% | 24.60% | 7.70% | 6.20% | 1.50% | 1.50% |
| 626-650 | 42.10% | 5.30% | 5.30% | 7.90% | 13.20% | 10.50% | 6.60% | 3.90% | 5.30% |
| 601-625 | 52.10% | 4.10% | 5.50% | 4.10% | 15.10% | 6.80% | 4.10% | 4.10% | 4.10% |
| 576-600 | 46.60% | 5.20% | 3.40% | 5.20% | 5.20% | 6.90% | 8.60% | 6.90% | 12.10% |
| 551-575 | 50.00% | 0.00% | 0.00% | 3.70% | 9.30% | 5.60% | 5.60% | 5.60% | 20.40% |
| 526-550 | 42.60% | 8.20% | 3.30% | 0.00% | 9.80% | 3.30% | 3.30% | 11.50% | 18.00% |
| 501-525 | 38.80% | 0.00% | 4.10% | 4.10% | 12.20% | 6.10% | 6.10% | 0.00% | 28.60% |
| 476-500 | 33.90% | 3.60% | 5.40% | 5.40% | 7.10% | 5.40% | 1.80% | 7.10% | 30.40% |
| 451-475 | 39.30% | 1.60% | 3.30% | 3.30% | 11.50% | 4.90% | 3.30% | 3.30% | 29.50% |
| 426-450 | 28.80% | 0.00% | 3.00% | 3.00% | 6.10% | 3.00% | 3.00% | 3.00% | 50.00% |
| 401-425 | 40.00% | 2.50% | 2.50% | 0.00% | 7.50% | 2.50% | 2.50% | 0.00% | 42.50% |
| 376-400 | 32.60% | 0.00% | 4.70% | 2.30% | 0.00% | 2.30% | 2.30% | 4.70% | 51.20% |
| 351-375 | 29.80% | 6.40% | 2.10% | 2.10% | 4.30% | 2.10% | 0.00% | 0.00% | 53.20% |
| 326-350 | 18.60% | 4.70% | 2.30% | 2.30% | 4.70% | 2.30% | 4.70% | 2.30% | 58.10% |
| 301-325 | 15.80% | 0.00% | 2.60% | 5.30% | 2.60% | 2.60% | 5.30% | 2.60% | 63.20% |
| 276-300 | 15.20% | 3.00% | 3.00% | 0.00% | 3.00% | 9.10% | 3.00% | 3.00% | 60.60% |
| 251-275 | 10.80% | 8.10% | 2.70% | 0.00% | 2.70% | 5.40% | 5.40% | 0.00% | 64.90% |
| 226-250 | 6.10% | 0.00% | 3.00% | 3.00% | 3.00% | 0.00% | 3.00% | 0.00% | 81.80% |
| 201-225 | 0.00% | 0.00% | 0.00% | 4.80% | 0.00% | 0.00% | 4.80% | 2.40% | 88.10% |
As an example, the first entry means 35.9 percent of batters with at least 676 PA one year amassed at least 10 percent fewer the following season. That is, 35.9 percent had no more than 608 the next campaign.
It should be pointed out the data was not normalized for league scoring. This skews things a little, but not enough to discount the big picture. It's crucial to observe most full-time players lose playing time one year to the next. This doesn't mean you can't peg someone for more PA than last season; just don't go overboard with the number of players expected to exceed last season's total.
So friends, there you have what you need to generate your own hitting projections. For the record, the last two points apply to innings estimation as well.
- Better teams get more plate appearances.
- Spot in the batting order is important.
- Try not to over-project good players or players you naturally favor. Be fair.
- Most full-time players fall short of the previous season's PA or IP.